
Using Ediff Mode on two open buffers and Tramp to access a remote box. Couldn’t be easier.
Monthly Archives: November 2008
Well that’s one hack down
I’ve started to use Contemplate for Philly Future to modify outgoing RSS. Previously I was modifying template.module directly to inject to default categories into every item’s RSS node. Hacking up core modules is a no-no.
My brother started his own blog
Hi Dante 🙂
On Sean Levert’s Horrific Death During Xanax Withdrawl
A terrible story that should never have happened: Cleveland.com: Sean Levert, denied medication, hallucinated for hours before he died in jail:
R&B singer Sean Levert entered the Cuyahoga County Jail on March 24 clutching the prescribed medication he took regularly for anxiety.
Jail staff took the bottle of Xanax away from him and failed to give him a single pill during the six days he was there, investigators said. Even when he began suffering horrifying delusions, he wasn’t given his medication and never saw a doctor.
Instead, on March 30, jailers strapped Levert into a restraint chair, still fighting the monstrous visions in his head caused by withdrawal from the medication. Minutes later, the 39-year-old son of O’Jays star Eddie Levert stopped breathing. His heart then stopped and doctors couldn’t save him.
Metafilter: Xanax withdrawal isn’t pretty
Google I/O 2008 – Apache Shindig presentation
Technology and business model shifts can drive innovation
David Cohn, contributor at Columbia Journalism Review, Seed Magazine and Wired has been exploring the future of journalism for a long time now, notably on his blog, at NewAssignment.net and NewsTrust.net.
His latest effort, funded by the Knight News Challenge, is Spot.us – a service founded on the principal that journalism is a process and not a product.
It’s an interesting effort. It joins other non-profit journalism resources such as NPR and ProPublica in working to solve the funding question that has been consuming those who want to see journalism flourish as business models and technologies shift. In this particular solution – it is YOU who determines what stories you fund directly.
Commentary by Dan Gillmor: Spot.us Launches
Commentary by Beth Kanter: Spot.Us: Community Funded Reporting
By Digidave himself on his blog: Launching The Spot.Us Ship: Community Funded Reporting
And introducing the service at vimeo: Spot.Us – Community Funded Reporting Intro:
Spot.Us – Community Funded Reporting Intro from Digidave on Vimeo.
And yes, this is me riffing off of a great conversation that was held by Aaron and Arpit at BarCampPhilly.
BarCamp Philly Was Terrific
I rarely get out that much, but I am so glad I made it to BarCamp Philly. It helped to surface what is a growing, thriving, media and technology scene in the city. I am very happy to have had the opportunity to listen in on and take part in, so many great conversations about our passions, the work we do, and the city.
Wow.
Election Result Maps
Data visualizations can sometimes spur us into contemplative directions. Sometimes they can put us to sleep. These are some of the more interesting election visualizations I’ve come across:
Mark Newman, Department of Physics and Center for the Study of Complex Systems, University of Michigan: Election Maps
Robert J. Vanderbei, Professor and Chair, Operations Research and Financial Engineering, Princeton: Purple America
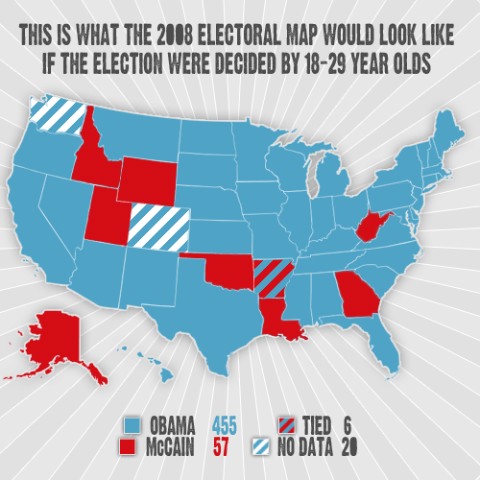
What the electoral map would look like if decided by 18-29 year olds
NYTimes: Election Results 2008
Interesting Analysis
David Kuhn: Politico: That huge voter turnout? Didn’t happen: “Between 60.7 percent and 61.7 percent of the 208.3 million eligible voters cast ballots this year, compared with 60.6 percent of those eligible in 2004”
Andrew Sullivan: He Saw It Coming: McCain/Palin ran a post-modern campaign (unlike Sullivan, I think it almost worked).
CNN: Number of votes cast set record, but voter turnout percentage didn’t
Associated Press: No hidden white bias seen in presidential race
CSMonitor: Obama made inroads with religious vote
NYTimes: This American Moment – The Surprises: Guess who Joe the Plumber voted for?
Salon.com: How Obama won, by the numbers: “The 18-to-29-year-old cohort supported Obama by a 2-to-1 margin (66-32), and while it is too soon to gauge precise turnout measures, their numbers clearly grew.”
Salon.com: Obama and the dawn of the Fourth Republic
NYTimes: Dissecting the Changing Electorate
Vote swings in rich and poor countries
Red State, Blue State, Rich State, Poor State: Election 2008: what really happened
Interesting Tools:
A Beautiful WWW: 20 Useful Visualization Libraries
physorg.com: Visualizing election polls
IBM’s Many Eyes
Obama Wins!
I never have bought into ‘the one’. But the good thing is Obama has never bought into that either – it’s always been about us as a community, as a country, as a people.
Yes We Can.
And yes, it’s about time.
2000: Long lines FL and OH, 2004: long lines OH, 2008: long lines every contested state?
Watch where the long lines form and where they don’t. Keep a close eye on that.
Stay in line, don’t do a provisional ballot unless absolutely necessary! Make sure your vote counts!